Live Tweeting Haumea: the Open Science Ratchet at work?

Eugenie Samuel Reich just announced on the Nature NewsBlog that astronomer Mike Brown live-tweeted his observations of a transit of dwarf planet Haumea by its moon, Namaka.

About a year ago, I wrote about Mike Brown and the controversy about the discovery of Haumea stemming from a competitor's more aggressive data dissemination practice. In that post I speculated that we could expect accelerated data sharing over time due to the Open Science Ratchet, where the actions of scientists that are most open set the pace for everyone else working on that particular project, regardless of their views on how secretive science should be.

I don't know if Mike Brown has changed his views on data sharing - or if he has always felt this way but thought it was too risky until now. Either way, he certainly is taking the lead at this point to demonstrate how radical openness can be done in astronomy!

Google Apps Scripts for an intuitive interface to organic chemistry Open Notebooks

Rich Apodaca recently demonstrated how Google Apps Scripts can be added to Google Spreadsheets to enable simple calling of web services for chemistry applications (gChem). Although we have been using web service calls from within a Google spreadsheet for some time (solubility calculation by NMR link #3 and misc chem conversions link #1), the process wasn't as intuitive as it could be because one had to find then paste lengthy urls.

Rich's approach enables simply clicking the desired web service from a menu on Google Spreadsheets and these functions have simple names like getSMILES. Andrew Lang has now added several web services from our ONS projects and the CDK. There are now 3 menus to choose from: gChem, gCDK and gONS.


To demonstrate the power of these tools consider the rapid construction of a customized interface to an experiment in a lab notebook (in this example UC-EXP263).

1) Because Andy has added a gONS service to render images of molecules from ChemSpider, consistent reaction schemes can now be constructed from this template by simply typing the name of the reactants and products then embedding in the wiki.

2) Planning of the reaction to calculate reactant amounts and product yield can then be processed by simply typing the name of the chemicals. Services calling molecular weight and density are automatic based on the chemical name as input.


3) Typing the name of the solvent then allows easy access to the solubility properties of the reaction components. The calculated concentrations of the reactants and product can be directly compared with their measured maximum solubility. In this experiment the observed separation of the product from the solution is consistent with these measurements.

4) Both experimental and predicted melting points (using Model002) can then be lined up for comparison. A large discrepancy between the two would flag a possible error - in this case good agreement is found. Noting that the product's melting point is near room temperature (53 C) explains why two layers were were observed to form during the course of the reaction and cooling to 0 C induced the product to precipitate. Links to the melting measurements are also provided in column N for easy exploration.

5) Column O provides a quick link to the ChemSpider entries for all compounds and column P provides links to the Reaction Attempts Explorer where, for example, one can explore other reactions where the product was involved. Finally columns Q and R provide one click access to an interactive NMR spectrum of the product, powered by ChemDoodle.

The last few columns still use our older code to call web services but over time these should be added to the gONS collection for convenience.

The easiest way to experiment with this interface is probably to just make a copy (File -> Make a Copy from the Google Spreadsheet menu). The sheet can then be customized for other applications.

The 4-benzyltoluene melting point twist

Evan Curtin and I were in the lab this morning to follow up on our effort to curate the melting point of 4-benzyltoluene. I identified the next step to confirm an upper limit of -15 C:

With the information available thus far from our experiments (UC-EXP266), we think it is unlikely that the +4.6 C value can be correct because we observed no solidification after 2 days at -15 C. The patent reports that solidification of some viscous mixtures took up to a full week but we did not observe an appreciable increase in viscosity for 4-benzyltoluene at -15 C. But in order to be sure we will first freeze the sample again below -40 C and let it warm up to -15 C in the freezer and confirm that it melts completely.

But when we took the sample out of the freezer after 16 days it was completely frozen!

This now effectively ruled out the -30 C value and re-opened the possibility that the +4.6 C value could be the best estimate. Learning from our previous failed attempt to observe a temperature plateau when heating the sample, this time we let it warm as slowly as possible by leaving it in an ice water bath inside of a Styrofoam container. This worked much better as the sample warmed a few degrees over several hours. This time Evan observed a clear transition from the solid to the liquid phase in the 4-6 C range.(UC-EXP266)

The curation record for the melting point of 4-benzyltoluene now looks like this:

When I introduce the concept of Open Notebook Science in my talks I usually make the point that there are no facts - just measurements embedded within assumptions.

The 4-benzyltoluene melting point story is a really good example of this principle. When I stated that I thought that "it is unlikely that the +4.6 C value can be correct because we observed no solidification after 2 days at -15 C", it was not the measurement that was in error - it was the interpretation. And when new information came to light, an experiment was proposed to either challenge or further support that interpretation. There were never any "facts" in this story (nor is the +4.6 C value a "fact" from these results).

I think that this is how science functions best and most efficiently. Unfortunately we don't usually have access to all pertinent raw measurements, assumptions and interpretations. I would be extremely interested in seeing how the -30 C value was determined. This is actually the value provided by the company that sold us this batch of material (as well as the PhysProp entry in the image above). Because of slow crystallization, I can see how this could happen if the temperature was dropped until solidification was observed. In our observations, the -30 C to -35 C range is roughly where we observed rapid solidification upon cooling. (UC-EXP266)

More on 4-benzyltoluene and the impact of melting point data curation and transparency

There are many motivations for performing scientific research. One of these is the desire to advance public scientific knowledge.

This is a difficult concept to quantify or even qualitatively assess. One can try to use literature citations and impact factors but that captures only a small fraction of the true scientific impact. For example, one formal citation of our solubility dataset doesn't represent the 100,000 anonymous solubility queries made directly to our database. And of these the actual impact will depend on exactly how the information was used. Egon Willighagen has identified this as a problem for the Chemistry Development Kit (CDK) as well: many more people use the CDK than reflected simply by the number of citations to the original paper.

There are a few of us who believe that curating chemistry data is a high impact activity. Antony Williams spends a considerable amount of time on this activity and frequently uncovers very serious errors from a number of data sources. Andrew Lang and I have put in a similar effort in collecting and curating solubility measurements openly - and recently (with Antony) we have been doing the same for melting points.

Although attempting to estimate the total impact of the curation activity isn't really practical, we can look at a specific and representative example to capture the scope.

I recently exposed the situation with the melting point measurements of 4-benzyltoluene. In brief, the literature provided contradictory information that could not be resolved without performing an experiment. Although an exact measurement was not found, a limit was determined that ruled out all measurements except for one.

Ironically it turns out that the melting point of this compound is its most important property for industrial use! Derivatives of diphenylmethane were sought out to replace PCBs as electrical insulating oils for capacitors because of toxicity concerns. As described in this patent (US5134761), for this application one requires the oil to remain liquid down to -50 C. Another key requirement is the ability to absorb hydrogen gas liberated at the electrode surface (a solubility property). Since this is optimal for smaller alkyl groups on the rings, it places benzyltoluene isomers at the focal point of research for this application.

The patent states: "According to references, the melting points of the position isomers of benzyltoluenes are as follows..." but does not make a specific reference. However, by comparing the numbers with other sources we can presume that the reference is the Lemneck1954 paper I discussed previously.

The patent then uses these melting points to calculate the melting behavior of mixtures of these isomers, as they obtain without further purification from a Friedel-Crafts reaction.


If our results are correct and the melting point of 4-benzyltoluene is not +4.6 C but well below -15 C, then the calculated properties in the patent may be significantly in error as well. With the information available thus far from our experiments (UC-EXP266), we think it is unlikely that the +4.6 C value can be correct because we observed no solidification after 2 days at -15 C. The patent reports that solidification of some viscous mixtures took up to a full week but we did not observe an appreciable increase in viscosity for 4-benzyltoluene at -15 C. But in order to be sure we will first freeze the sample again below -40 C and let it warm up to -15 C in the freezer and confirm that it melts completely.


It is in light of this analysis that I make the case that open curation of melting point data is likely to be a high impact activity relative to the amount of time required to perform it. The problem is that errors such as these cascade through the scientific record and likely retard scientific progress by causing confusion and wasted effort. Consider the total cost in terms of research and legal fees for just one patent. As I discussed previously, consider the effect of compromised and contradictory data now known to exist within training sets on the pace of developing reliable melting point models (cascading down to solubility models dependent upon melting point predictions or measurements - and ultimately cascading to the efficiency of drug design).

It is important to note that the benefits of curation would be greatly diminished without the component of transparency. We are not claiming to provide a "trusted source" of melting point data. There is no such thing - and operating under the illusion of the trusted source model has resulted in the mess we are in now - with multiple melting point values for the same compound cascading and multiplying to different databases (a good and still unresolved example is benzylamine).

What we are doing is reporting all the sources we can use and marking some sources as DONOTUSE so they are not included in the calculation of the average - with an explanation. We never delete data so users can make informed choices and not be in a position of having to trust our judgement. If someone does not agree with me that failure to freeze after 2 days at -15 C does not necessarily rule out the +4.6 C value for the melting point for 4-benzyltoluene then they are free to use it.

Using a trusted source model, all values within a collection are equally valid. In the transparency model not all values are equal - we are justifiably more confident in a melting point value near -114 C for ethanol than for a melting point with a single source (like this compound).

And finally, an important factor for having an impact on science is discoverability. It is likely that someone doing research involving the melting behavior of 4-benzyltoluene would perform at least quick Google search. What they are likely to find is not just a simple number without provenance but rather a collection of results capturing the full subtlety of the situation under discussion. This is a natural outcome of working transparently.

My talk at SLA on Trust in Science and Open Melting Point Collections

On June 14 and 15, 2011 I attended the Special Libraries Association conference and made presentations on two panels on the role of trust in science with a case-study of the Open Melting Point collections that Andrew Lang, Antony Williams and I have been assembling and curating.

The first panel was on the "International Year of Chemistry: Perils and Promises of Modern Communication in the Sciences". My colleague Laurence Souder from the Department of Culture and Communications at Drexel presented on "Trust in Science and Science by Blogging", using as an example the NASA press release on arsenic replacing phosphorus in bacteria and subsequent controversy taking place in the blogosphere. (see post in Scientific American blog today)

Watch Lawrence Souder's presentation screencast and slides.

The second panel was on "New Forms of Scholarly Communications in the Sciences". Don Hagen from the National Technical Information Service presented on "NTIS Focus on Science and Data: Open and Sustainable Models for Science Information Discovery" and Dorothea Salo discussed the evolving role of libraries and institutional repositories on scholarly communication and archiving.

Watch Don Hagen's presentation screencast and slides.

My own slides and screencast from the second panel are available below:

More Open Melting Points from EPI and other sources: on the path to ultimate curation

As recently as 2008, Hughes et al published a paper asking: Why Are Some Properties More Difficult To Predict than Others? A Study of QSPR of Solubility, Melting Point, and Log P

The question then is: why do QSPR models consistently perform significantly worse with regard to melting point? In the Introduction, we proposed three reasons for the failure of QSPR models: problems with the data, the descriptors, or the modeling methods. We find issues with the data unlikely to be the only source of error in Log S, Tm, and Log P predictions. Although the accuracy of the data provides a fundamental limit on the quality of a QSPR model, we attempted to minimize its influence by selecting consistent, high quality data... With regards to the accuracy of Tm and Log P data, both properties are associated with smaller errors than Log S measurement. Moreover, the melting point model performed the worst, yet it is by far the most straightforward property to measure...We suggest that the failure of existing chemoinformatics descriptors adequately to describe interactions in the crystalline solid phase may be a significant cause of error in melting point prediction.

Indeed, I have often heard that melting point prediction is notoriously difficult. This paper attempted to discover why and suggested that it is more likely that the problem is related to a deficiency in available descriptors rather than data quality. The authors seem to argue that taking a melting point is so straightforward that the resulting dataset is almost self-evidently high quality.

I might have thought the same before we started collecting melting point datasets.

It turns out that validating melting points can be very challenging and we have found enormous errors - even cases where the same compound in the same dataset is assigned very different melting points. Under such conditions it is mathematically impossible to obtain high correlations between predicted and "measured" values.

Since we have no additional information to go on (no spectral proof of purity, reports of heating rate, observations of melting behavior, etc.) the only way we can validate data points is to look for strong convergence from multiple sources. For example, consider the -130 C value for the melting point of ethanol (as discussed previously in detail). It is clearly an outlier from the very closely clustered values near -114 C.


This outlier value is now highlighted in red to indicate that it was explicitly identified to not be used in calculating the average. Andrew Lang has now updated the melting point explorer to allow a convenient way to select or deselect outliers and indicate a reason (service #3). For large separate datasets - such as the Alfa Aesar collection - this can be done right on the melting point explorer interface with a click. For values recorded in the Chemical Information Validation sheet, one has to update the spreadsheet directly.

This is the same strategy that we used for our solubility data - in that case by marking outliers with "DONOTUSE". This way, we never delete data so that anyone can question our decision to exclude data points. Also by not deleting data, meaningful statistical analyses of the quality of currently available chemical information can be performed for a variety of applications.

The donation of the Alfa Aesar dataset to the public domain was instrumental in allowing us to start systematically validating or excluding data points for practical or modeling applications. We have also just received confirmation that the entire EPI (PhysProp) melting point dataset can be used as Open Data. Many thanks to Antony Williams for coordinating this agreement and for approval and advice from Bob Boethling at the EPA and Bill Meylan at SRC.

In the best case scenario, most of the melting point values will quickly converge as in the ethanol case above. However, we have also observed cases where convergence simply doesn't happen.

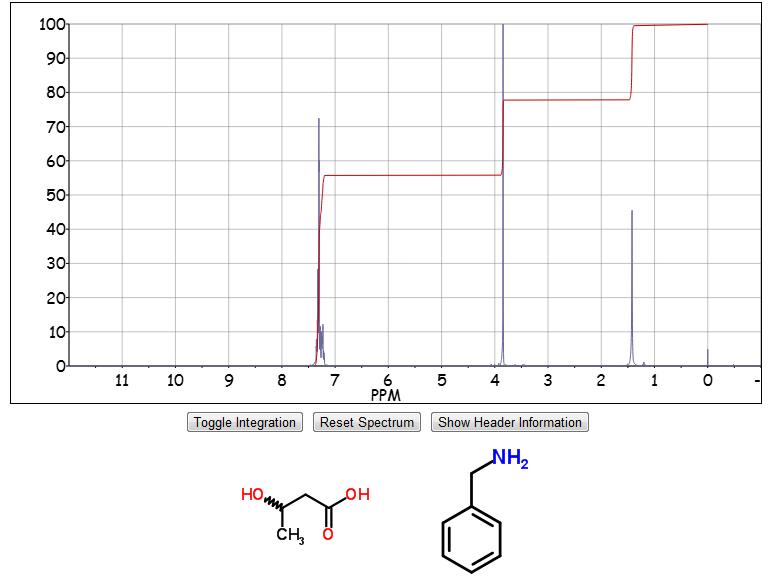
Consider the collection of reported melting points for benzylamine.


One has to be careful when determining how many "different" values are in this collection. Identical values are suspicious since they may very well originate from the same ultimate source. Convergence for the ethanol value above is credible because most of the values are very close but not completely identical, suggesting truly independent measurements.

In this case values actually diverge into sources of either +10 C, - 10 C, -30 C or about -45 C. If you want to play the "trusted source" game, do you trust more the Sigma-Aldrich value at +10C or the Alfa Aesar value at -43 C?

Lets try looking at the peer-reviewed literature. A search on SciFinder gives the following ranges:

The lowest melting point listed there is the +10C value we already have in our collection but these references are to other databases. The lowest value from a peer-reviewed paper is 37-38 C.

This is strange because I have a bottle of benzylamine in my lab and it is definitely a liquid. Investigating the individual references reveals a variety of errors. In one, benzylamine is listed as a product but from the context of the reaction it should be phenylbenzylamine:


(In a strange co-incidence the actual intermediate - benzalaniline - is the imine that Evan Curtain has synthesized recently in order to measure its solubility)

In another example, the melting point of a product is incorrectly associated with the reactant benzylamine:

The erroneous melting points range all the way up to 280 C and I suspect that many of these are for salts of benzylamine, as I reported previously for the strychnine melting point results from SciFinder.

With no other obvious recourse from the literature to resolve this issue, Evan attempted to freeze a sample of benzylamine from our lab.(UC-EXP265)


Unfortunately, the benzylamine sample proved to be too impure (<85% by NMR) and didn't solidify even down to -78 C. We'll have to try again from a much more pure source. It would be useful to get reports from a few labs who happen to have benzylamine handy and provide proof of purity by NMR and a pic to demonstrate solidification.

As most organic chemists will attest, amines are notorious for appearing as oils below their melting points in the presence of small amounts of impurities. I wonder if the divergence of melting points in this case is due to this effect. By providing NMR data from various samples subjected to freezing, it might be possible to quantify the effect of purity on the apparent freezing point. I think the images of the solidification are also important because I think that some may mistake very high viscosity with actual formation of a solid. At -78 C we observed the sample to exhibit a viscosity similar to that of syrup.

Our model predicts a melting point of about -38 C for benzylamine and so I suspect that the values of -43 C and -46 C are most likely to be close to the correct range. Lets find out.

The quest to determine the melting point of 4-benzyltoluene

reported that we are attempting to curate the open melting point measurements collected from multiple sources such as Alfa Aesar, PhysProp (EPIsuite) and several smaller collections. I mentioned that some values - like benzylamine - simply don't converge and the only way to resolve the issue is to actually get a high purity sample and do a measurement.Since that report, we found another non-converging situation with 4-benzyltoluene. As shown below, reported measurements range from -30 C to 125C.The values in red have been removed from the calculation of the average based on evidence we obtained from ordering the compound from TransWorld Chemicals and observing its behavior when exposed to various temperatures. The details can be found from UC-EXP266 (which I performed with Evan Curtin).Immediately after opening the package it was clear that the compound was a liquid and thus the 125C and 98.5C values became improbable enough to remove.
First Evan Curtin and I dropped the still sealed bottle into an ice bath (0C) and after 10 minutes there was no trace of solidification.
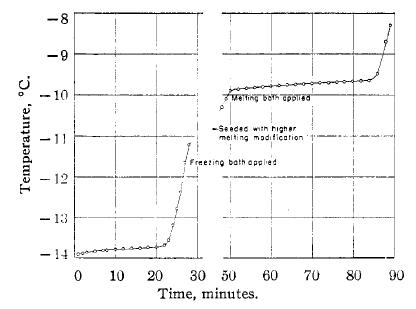
At this point, this does not necessarily rule out the values near 5C because of the short time in the bath.We then used an acetone/dry ice bath and did see a rapid and clear solidification after reaching -30C to -35C.Letting the bath temperature rise it was difficult to tell what was happening but there seemed to be some liquefaction around -12C.In order to get a more precise measurement, we transferred about 2 mls of the sample into a test tube and introduced the thermometer directly in contact with the substance. After quickly freezing the contents in a dry ice/acetone bath, the sample was removed and its behavior was observed over time, as shown below.
I was expecting to see the internal temperature rise then plateau at the melting point until all the solid disappeared and then finally observe a second temperature rise. This comes from experience in making 0C baths within minutes by simply throwing ice into pure water.As shown above that is not at all what happened. The liquid formed gradually starting at about -9C and never reached a plateau even up to +7C, where there was still much solid left.If we look at the method used to generate the 4.58 C value (Lamneck1954) we find that a similar method was cited - but not actually described there. The actual curves are not available either. However, this paper provides melting points for several compounds within a series, which is often useful for spotting possible errors - unless of course these are systematic errors. In this particular case it doesn't help much because the 2-methyl derivative is similar but the 3-methyl analogue is very close to -30 C value listed in our sources.Notice that one of the "melting points" (3-methyldicyclohexylmethane) is not even measurable because it forms a glass. It is easy to see how melting points below room temperature can generate very different values - and very difficult to assess if the full experimental details of the measurements are not reported.Trying to get at more details lets look at the referenced paper (Goodman1950). Indeed the researchers determine the melting point by plotting the temperature over time as the sample is heated and looking for a plateau. The obvious difference is that the heating rate is about an order of magnitude slower than in our experiment.
This paper also highlights the fact that there are more twists and turns in the melting point story. One compound (2-butylbiphenyl) was found to have 2 melting points that can be observed by seeding with different polymorphic crystals.
At this point, our objective of obtaining an actual melting point was replaced with trying to at least mark a reasonably confident upper limit. After leaving the sample at -15 C in a freezer for two days, no solidification was observed - not even an appreciable increase in viscosity. For this reason, all melting point values above -15C were removed from the calculation of the average and show up in red.With only the -30 C measurement left, this is now the default value for 4-benzyltoluene - until further experimentation.

]]>

Open Melting Points on iPhone via MMDS

As Alex Clark explained on his blog Cheminformatics 2.0, both predicted and experimental melting points from our Open Data collection are now available on iPhones via his MMDS webservices protocol.


Although the app is not free, the web service (#7 from our collection) that Andrew Lang and Alex created for this purpose is Open and available for anyone to use. It reads an XML formatted molfile and returns the average measured melting point, predicted melting point, SMILES, CSID and a link to the ChemSpider entry.

Breast Cancer Coalition talk on ONS and Taxol solubility

On May 1, 2011 I presented "Accelerating Discovery by Sharing: a case for Open Notebook Science" at the National Breast Cancer Coalition Annual Advocacy Conference in Arlington, VA. This was the first year where they had a session on an Open Science related theme and the organizers invited me to highlight some of the tools and practices in chemistry which might be applicable to cancer research.

I was really touched by the passion from those in the audience as well as the other speakers and conference participants I met afterward. For many, their deep connection with the cause was strongly rooted in a personal experience as breast cancer survivors themselves or their loved ones. Several expressed a frustration with the current system of sharing results from scientific studies. They felt that knowledge sharing is much slower than it needs to be and that potentially useful "negative" results are generally not disclosed at all.

The NBCC has ambitiously set 2020 as the deadline to end breast cancer (including a countdown clock). It seems reasonable to me that encouraging transparency in research is a good strategy to accelerate progress. Of course, great care must be exercised wherever patient confidentiality is a factor. But health care researchers are already experienced with following protocols to anonymize datasets for publication. Opting to work more openly would not change that but it might affect when and how results are shared. Also there is a great deal of science related to breast cancer that does not directly involve human subjects.

One initiative that particularly impressed me was The Susan G. Komen for the Cure Tissue Bank, presented by Susan Clare from Indiana University and moderated by Virginia Mason from the Inflammatory Breast Cancer Research Foundation. As a result of this effort, thousands of women have donated healthy breast tissue to create a comprehensive database richly annotated with donor genetics and medical history. The idea of trying to tackle a disease state by first understanding normal functioning in great detail was apparently somewhat of a paradigm shift for the cancer research community and it was challenging to implement. According to Dr. Clare, data from the Tissue Bank have shown that the common practice of using apparently unaffected tissue adjacent to a tumor as a control may not be valid.

This example highlights one of the key principles of Open Science: there is value in everyone knowing more - even if it isn't immediately clear how that knowledge will prove to be useful.

In my experience, this is a fundamental point that distinguishes those who are likely to favor Open Science from those who reject its value. If two researchers are discussing Open Science and only one of them views this philosophy as being self-evident the conversation will likely be about why someone would want (or not want) to share more and the focus will fall on extrinsic motivators such as academic credit, intellectual property, etc. If both researchers view this philosophy as self-evident the conversation will probably gravitate towards how and what to share.

I refer to this philosophy as being self-evident because I don't think people can become convinced through argumentation (I've never seen that happen). Within the realm of Open Notebook Science I have been involved in countless discussions about the value of sharing all experimental details - even when errors are discovered. I can think of a few ways in which this is useful - for example telegraphing a research direction to those in the field or providing data for researchers who study how science is actually done (such as Don Pellegrino). But even if I couldn't think of a single application I believe that there is value in sharing all available data.

A good example of this philosophy at work is the Spectral Game. Researchers who uploaded spectral data to ChemSpider as Open Data did not anticipate how their contribution would be used. They didn't do it for extrinsic motives such as traditional academic credit. Assuming that their motivation was similar to our group's, they did it because they believed it was an obviously useful thing to do. It is only much later - after a critical mass of open spectra were collected - that the idea arose to create a game from the dataset.

With this mindset, I explored what contribution we might make to breast cancer research by performing a phrase search strategy. Doing a simple Google search for "breast cancer" solubility generated mainly two types of results.

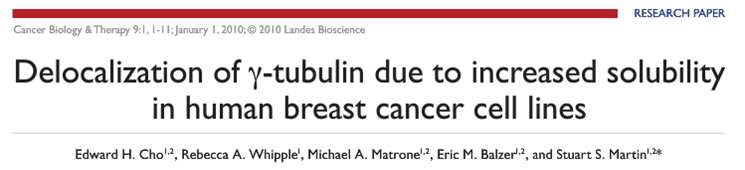
The first set involve the solubility behavior of biomolecules within the cellular environment. An example would be the observed increased solubility of gamma-tubulin in cancerous cells.
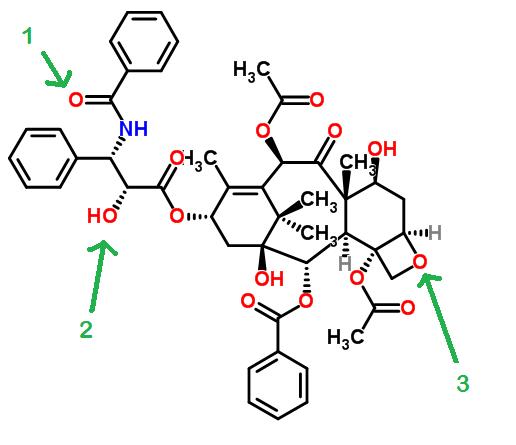
The second type of results address the difficulty in preparing formulations for cancer drugs due to solubility problems. A good example of this is Taxol (paclitaxel), where existing excipients are not completely satisfactory - in the case of Cremophor EL some patients experience a hypersensitivity.
Since our modeling efforts thus far have focused on non-aqueous solubility, there is possibly an opportunity to contribute by exploring the solubility behavior of paclitaxel. By inputting solubility data from a paper by Singla 2002 into our solubility database, Abraham descriptors for paclitaxel are automatically calculated and the solubilities in over 70 solvents are predicted.

In addition, by simply adding the melting point of paclitaxel, we automatically predict its solubility at any temperature where these solvents are liquids (see for example water).

Because of the way we expose our results to the web, a Google search for "paclitaxel solubility acetonitrile" now returns the actual value in the Google summary on the first page of results (currently 7th on the first page). The other hits have all 3 keywords somewhere in the document but one has to click on each link then perform a search within the document to find out if the acetonitrile solubility for paclitaxel is actually reported. (Note that clicking on our link ultimately takes you to the peer-reviewed paper with the original measurement.)

To be clear about what we are doing here - we are not claiming to be the first to predict the solubility of paclitaxel in these solvents using Abraham descriptors or any other method. Nor are we claiming that we have directly made a dent in the formulation problem of paclitaxel. We are not even indicating that we have done a thorough search of the literature - that would take a lot more time than we have had given the enormous amount of work on paclitaxel and its derivatives.

All we are doing is fleshing out the natural interface between the knowledge space of the UsefulChem/ONS Challenge projects and that of breast cancer research - AND - we are exposing the results of that intersection through easily discoverable channels. By design, these results are exposed as self-contained "smallest publishable units" and they are shared as quickly (and as automatically) as possible. The traditional publication system does not have mechanism to disseminate this type of information. (Of course when enough of these are collected and woven into a narrative that fits the criteria for a traditional paper they can and should be submitted for peer-reviewed publication).

Here is a scenario for how this could work in this specific instance. A graduate student (who has never heard of Open Science or UsefulChem, the ONS Challenge, etc.) is asked to look for new formulations for paclitaxel (or other difficult to solubilize anti-cancer agents). They do a search on commercial databases offered by their university for various solubilities of paclitaxel and cannot find a measurement for acetonitrile. They then do a search on Google and find a hit directly answering their query, as I detailed above. This leads them to our prediction services and they start using those numbers in their own models.

That is a good outcome - and that is exactly what has been happening (see the gold nanodot paper and the phenanthrene soil contamination study as examples). But the real paydirt would come from the graduate student recognizing that we've done a lot of work collecting measurements and building models for solubility and melting points, and contact us about a collaboration. As long as they are comfortable with working openly we would be happy actively work together.

I'm using the formulation of paclitaxel as an example but I'm sure that there are many more intersections between solubility and breast cancer research. With a bit of luck I hope we can find a few researchers who are open to this type of collaboration.

As another twist to this story, I will briefly mention here too that Andrew Lang has started to screen our Ugi product virtual library for docking with the site where paclitaxel binds to gamma-tubulin (D-EXP018). This might shed some light on some much cheaper alternatives to the extremely expensive paclitaxel and derivatives. The drug binds through 3 hydrogen bonds, shown below - rendered in 2D and 3D representations (obtained from the PDB ligand viewer)


The slides and recording of my talk are embedded below:

La Science par Cahier de Laboratoire Ouvert à l’Acfas

On May 9, 2011 I presented remotely for the French-Canadian Association for the Advancement of Science (ACFAS). This was the first time I gave a talk about Open Notebook Science in French. In fact the last time I gave a scientific talk in French was probably in 1995, when I was doing a postdoc at the Collège de France in Paris. I remember being teased for my French Canadian accent back then so happily that wasn't an issue this time. Even though I was a bit rusty I think I managed to communicate the key points well enough. (At least I hope I did)

My presentation was a good fit for the theme of the conference: Une autre science est possible : science collaborative, science ouverte, science engagée, contre la marchandisation du savoir. (Another Science is possible: collaborative science, open science, against the commercialization of knowledge). I would like to thank the organizers (Mélissa Lieutenant-Gosselin and Florence Piron) for inviting me to participate.

I was able to record most of the talk (see below) but very near the end Skype decided to install an update and shut down so the recording ends somewhat abruptly. Given what people use Skype for, that default setting for updates really doesn't make much sense.

ACS and ACRL presentations on web services and trust in science

On March 30 and 31, 2011 I presented two related talks - the first remotely for the American Chemical Society (ACS) Meeting and the second in Philadelphia at the meeting for the Association of College and Research Libraries (ACRL).

In the ACS talk "Rapid Dissemination of Chemical Information for people and machines using Open Notebook Science", I spoke for the first time in detail about the results of the open modeling Andrew Lang and I carried out on the open dataset of melting points we collected starting with the Alfa Aesar dataset recently made public.

We used Skype and Google Presenter with the help of Peter Murray-Rust on site at the conference and it went fairly well I think. Henry Rzepa had a good question about polymorphism possibly being responsible for different melting points from various sources. I don't think that is the problem in most of these cases but we can certainly spend some time investigating the reports of polymorphism for cases where the information is available. One of the big problems is that we don't know the history of the sample used for a melting point from most sources like chemical vendor sites. At least in journal articles we might be told which solvent was used to crystallize the sample. If multiple sources agree on a certain melting point and there is one outlier, I think it is reasonable to assume that the common melting point is likely to correspond to the thermodynamically favored polymorph. This might not be correct in all cases but - without the means to discover more information about the sample histories - I think it makes sense to proceed in this way. Since we don't consider polymorphism in our modeling, there is an implicit assumption that - in the case of polymorphism - we are dealing with the thermodynamically most stable form.

My ACRL talk "Is there a role for Trust in Science?" focused more on the Chemical Information Validation study and outcomes. There were several good questions at the end. One particularly good comment addressed my speculation that within a few years, the open models in most of the useful chemical spaces will be sufficiently good that it will be as easy to Google a melting point or a solubility as it is now to get driving directions. The question was: weren't we just replacing trust from one information source to another, namely these models. I don't think the concept of trust applies in these cases because the training sets, the descriptors and the performance of the models are (and will be) open. This is in sharp contrast with most commercial software generating predictions for solubility and melting points - these are generally black boxes because either the training set, the model or the descriptors are not open.

Evan Curtin is the May 2011 RSC ONS Challenge Winner

Evan Curtin, a chemistry freshman student working under the supervision of Jean-Claude Bradley at Drexel University, is the May 2011 Royal Society of Chemistry Open Notebook Science Challenge Award winner. He wins a cash prize from the RSC.

Evan's primary focus has centered on synthesizing aromatic imines and measuring their solubility in a number of organic solvents. This will allow us to generate Abraham descriptors for this class of compounds in order to predict their solubility in 70+ solvents. Coupled with our new model to include temperature dependent solubility, this should greatly facilitate optimal solvent prediction for this and related reactions.

Imine formation is of particular interest to the UsefulChem group because it is the first step of the Ugi reaction, which we have used to synthesize compounds with anti-malarial activity. But it is also a simple convenient reaction in itself to test our Solvent Selector's ability to predict optimal conditions (solvent and temperature) for isolation of products by precipitation.

Evan's synthesis experiments are available here:
http://usefulchem.wikispaces.com/Exp263
http://usefulchem.wikispaces.com/Exp262
http://usefulchem.wikispaces.com/Exp261


and his solubility experiments are listed here:

http://onschallenge.wikispaces.com/Exp207
http://onschallenge.wikispaces.com/Exp206
http://onschallenge.wikispaces.com/Exp205
http://onschallenge.wikispaces.com/Exp204
http://onschallenge.wikispaces.com/Exp201
http://onschallenge.wikispaces.com/Exp198
http://onschallenge.wikispaces.com/Exp197

Three more RSC ONS Awards will be made during 2011. Submissions from students in the US and the UK are still welcome.
For more information see:
http://onschallenge.wikispaces.com
http://onschallenge.wikispaces.com/RSCAwards2010

Collaboration using Open Notebook Science in Academia book chapter

I am very pleased to report that the book chapter that I co-wrote with Andrew Lang, Steve Koch and Cameron Neylon is now available online: Collaboration using Open Notebook Science in Academia. This is the 25th chapter of Collaborative Computational Technologies for Biomedical Research, edited by Sean Ekins, Maggie Hupcey, Antony Williams and Alpheus Bingham.

Our chapter provides some fairly detailed examples of how Open Notebook Science can be used to enhance collaboration between researchers from both similar or distant fields. It also suggests certain paths towards machine/human collaboration in science. Hopefully it will encourage researchers who have an interest in Open Science to experiment with some of the tools and strategies mentioned.

I am also grateful to Wiley for choosing our chapter as the free online sample for the book!

This book discusses the state-of-the-art collaborative and computing techniques for the pharmaceutical industry, the present and future implications and opportunities to advance healthcare research. The book tackles problems thoroughly, from both the human collaborative and the data and informatics side, and is very relevant to the day-to-day activities running a laboratory or a collaborative R&D project. It can be applied to help organizations make critical decisions about managing drug discovery and development partnership. The book follows a “man- methods-machine” format with sections on how to get people to collaborate, collaborative methods, and computational tools for collaboration. This book offers the reader a “getting started guide” or instruction on “how to collaborate” for new laboratories, new companies, and new partnerships, as well as a user manual for how to troubleshoot existing collaborations.

Validating Melting Point Data from Alfa Aesar, EPI and MDPI

I recently reported that Alfa Aesar publicly released their melting point dataset for us to use to take into account temperature in solubility measurements. Since then, Andrew Lang, Antony Williams and I have had the opportunity to look into the details of this and other open melting point datasets. (See here for links and definitions of each dataset)

An initial evaluation by Andy found that the Alfa Aesar collection yielded better correlations with selected molecular descriptors compared to the Karthikeyan dataset (originally from MDPI), an open collection of melting points used by several researchers to provide predictive melting point models. This suggested that the quality of the Alfa Aesar dataset might be higher.

Inspection of the Karthikeyan dataset did reveal some anomalies that may account for the poor correlations. First there were several duplicates - identical compounds with different melting points, sometimes radically different (up to 176 C). A total of 33 duplicates (66 measurements) were found with a difference in melting points greater than 10 C.(see ONSMP008 dataset) Here are some examples.


A second problem we ran into involved difficulty processing the SMILES in the Karthikeyan collection. Most of these involved SO2 groups. An attempt to view this SMILES string in ChemSketch ends up with two extra hydrogens on the sulfur.

[S+2]([O-])([O-])(OCC#N)c1ccc(C)cc1

Other SMILES strings render with 5 bonds on a carbon and ChemSketch draws these with a red X on the problematic atom. See for example this SMILES string:

O=C(OC=1=C2C=CC=CC2=NC=1c1ccccc1)C


Note that the sulfur compounds appear to render correctly on Daylight's Depict site:

In total 311 problematic SMILES from the Karthikeyan collection were removed (see ONSMP009).

With the accumulation of melting point sources, overlapping coverage is revealing likely incorrect values. For example, 5 measurements are reported for phenylacetic acid.

Four of the values cluster very close to 77 C and the other - from the Karthikeyan dataset - is clearly an outlier at 150 C.

In order to predict the temperature dependence for the solutes in our database, Andy collected the EPI experimental melting points, which are listed under the predicted properties tab in ChemSpider (ultimately from the EPA). (There are predicted EPI values there but we only used the ones marked exp).

This collection of 150 compounds was then listed in a spreadsheet (ONSMP010) and each entry was marked as having only an EPI value (44 compounds) or having at least one other measurement from another source (106 compounds). Out of those having at least one more value, 10 reported significant differences (> 5C) between the measurements. Upon investigation, many of these point strongly to the error lying with the EPI dataset. For example, the EPI melting point for phenyl salicylate is over 85 C higher than that reported by both Sigma-Aldrich and Alfa Aesar.


These preliminary results suggest that as much as 10% of the EPI experimental melting point dataset is significantly in error. Only a systematic analysis over time will reveal the full extent of the deficiencies.

So far the Alfa Aesar dataset has not produced many outliers, when other sources are available for comparison. However, even here, there are some surprising results. One of the most well studied organic compounds - ethanol - is listed with a melting point of -130 C by Alfa Aesar, clearly an outlier from the other values clustered around -114 C.

When downloading the Karthikeyan dataset from Cheminformatics.org, a Trust Level field indicates: "High - Original Author Data".

It would be nice if it were that simple. Unfortunately there are no shortcuts. There is no place for trust in science. The best we can do is to collect several measurements from truly independent sources and look for consensus over time. Where consensus is not obvious and information sources are exhausted, performing new measurements will be the only option left to progress.

The idea that a dataset has been validated - and can be trusted completely - simply because it is attached to a peer-reviewed paper is a dangerous one. This is perhaps the rationale used by projects such as Dryad,
where datasets are not accepted unless they are associated with a peer-reviewed paper. Peer review was not designed to validate datasets - even if we wanted it to, reviewers don't typically have access to enough information to do so.

The usefulness of a measurement is related much more to the details in the raw data provided by following the chain of provenance (when available) than it is in where it is published. To be fair, in the case of melting point measurements, there really isn't that much additional experimental information to provide, except perhaps an NMR of the sample to prove that it was completely dry. In such a case, we have no choice but to use redundancy until a consensus number is finally reached.

Open modeling of melting point data

The contribution of Alfa Aesar melting point data to our open collection has facilitated the validation of a significant amount of the entire dataset. However, this process of curation is never-ending. A good example is the discovery of an error in one of the sources for the melting point of warfarin. Following David Weinberger's post about our melting point explorer, his brother Andy noticed a problem and this enabled us to fix it.

In a way, creating an open environment to make it easy to find and report errors - as well as add new data - complicates scientific evaluation. In order to report a reproducible process and outcome, it is necessary to take a snapshot of the dataset. Choosing the exact composition of a dataset for a particular application is somewhat arbitrary. Aside from selecting a threshold for excluding measurements that deviate too much, compounds may be excluded based on their type.

For the sake of clarity, we archived the various datasets we created from multiple sources with brief descriptions of the filtering and merging at each step. From the perspective of an organic chemist, ONSMP013 is probably the most useful at this time. It contains averaged measurements for 12634 organic compounds and excludes salts, inorganics or organometallics. The original file provided by Alfa Aesar contained several of these excluded compounds and can be obtained from ONSMP000. It might be interesting at some point to create a collection of melting points for inorganics or salts. We would welcome contributions of collections of melting points with different filters.

One of the advantages of ONSMP013 is that it is possible to generate CDK descriptors for each entry (and these are included in the spreadsheet). By not using commercial software to generate descriptors, it enables fully transparent modeling - and extension of that modeling by anyone.

With this in mind, Andrew Lang has used ONSMP013 to generate a Random forest melting point model (MPM002). The most important descriptors turned out to be the number of hydrogen bond donors and the Topological Polar Surface Area (TPSA). The scatter plot below shows the correlation (R2 = 0.79) between the predicted and experimental values. (color represents TPSA and size relates to H-bond donors)


Andy has described in much more detail the rationale for selecting the Random forest approach over a linear model in MPM001. He has also compared the performance of CDK descriptors versus those from a commercial program for a small set of drug melting points in MPM003.

The Random forest model (MPM002) is also now available as a web service by entering the ChemSpiderID (CSID) of a compound in a URL. See this example for benzoic acid. If experimental results exist they will appear on top and a link to obtain the predicted melting point will appear underneath.

Note that the current web service for predicting melting points can be slow - it may take a minute to process.

Additional web services for melting point data will be listed on the ONS web services wiki.

Towards the automated discovery of useful solubility applications

Last week, I came across (via David Bradley) a paper by an MIT group regarding the desalination of water using a very clever application of solubility behavior:

Anurag Bajpayee, Tengfei Luo, Andrew Muto and Gang Chen, Energy Environ. Sci., 2011 Very low temperature membrane-free desalination by directional solvent extraction (article, summary)

The technique simply involves the heating of saltwater with molten decanoic acid to 40-80 C. Some water dissolves into the decanoic acid, leaving the salt behind. The layers are then separated and, upon cooling to 34C, sufficiently pure water separates out. Any traces of decanoic acid are inconsequential since this compound is already present in many foods at higher levels.

From a technological standpoint, I can't think of a reason why this solution could not have been discovered and implemented 100 years ago. It makes you wonder how many other elegant solutions to real problems could be uncovered by connecting the right pieces together.

To me, this is where the efforts of Open Science and the automation of the scientific process will pay off first. For this to happen on a global level, two key requirements must be met:

1) Information must be freely available, optimally as a web service (measurements if possible - otherwise a predicted value, preferably from an Open Model)
2) There has to be a significantly automated way of identifying what is important enough to be solved.

Since we have been working on fulfilling the first requirement for solubility data, I first looked at our available services to see if there was anything there that could have pointed towards this solution.

Although we have a measured (0.0004 M) and predicted (0.001 M) room temperature solubility of decanoic acid in water, our best prediction service can't do the opposite: the solubility of water in decanoic acid. For that we would need the Abraham descriptors for decanoic acid as a solvent and those are not yet available as far as I'm aware.

Also, we use a model to predict solubility at different temperatures - but it assumes that the solute is miscible with the solvent at its melting point. This is probably a reasonable assumption for the most part but it fails when the solute and the solvent are too radically dissimilar (e.g. water/hydrophobic organic compounds). In this particular application, decanoic acid melts at 31C and the process occurs in the 34-80 C range.

But even if we had the necessary models (and corresponding web services) for the decanoic acid/water/NaCl system, could it have been flagged in an automated way as being potentially "useful" or even "interesting"?

For utility assessment, humans are still the best source. Luckily, they often record this information tagged with common phrases in the introductory paragraphs of scientific documents. (In fact, this is the origin of the UsefulChem project). For example, if we search for "there is a pressing need for" AND solubility in a Google search, most of the results provide reasonable answers to the question of what a useful application of solubility might be. I have summarized the initial results in this sheet.

The first result is:
"there is a pressing need for new materials for efficient CO2 separation" from a Macromolecules article in 2005. The general problem needing solving would correspond to "global warming/CO2 sequestration" and the modeling challenge would be "gas solubility".

Analyzing the first 9 results in this way gives us the following problem types:

  1. global warming/CO2 sequestration
  2. fire control
  3. global warming/refrigeration fluid
  4. AIDS prevention
  5. Iron absorption in developing countries
  6. agriculture/making phosphate from rock bioavailable
  7. water treatment/flocculation
  8. natural gas purification/environmental
  9. waste water treatment

and the following modeling challenges:

  1. gas solubility
  2. polymer solubility
  3. hydrofluoroether solubility
  4. solubility of drug in gels
  5. inorganics
  6. inorganics/pH dependence of solubility
  7. polymer solubility/flocculation/colloidal dispersions
  8. gas solubility
  9. inorganics

These preliminary results are instructive. The problem types are broad and varied - and I think they will be helpful for keeping in mind as we continue to work on solubility. The modeling challenges can be compared directly with our existing services - and none of them overlap at this time! All of these involve either gasses, polymers, gels, salts, inorganics or colloids while our services are strictly for small, non-ionic organic compounds in liquid solvents.

Part of the reason for our focus on these types of compounds relates to our ulterior objective of assessing and synthesizing drug-like compounds. But a more important consideration is what type of information is available and what can be processed related to cheminformatics. Currently most cheminformatics tools deal only with organic chemicals, with essential sources such as ChemSpider and the CDK providing measurements, models, descriptors, etc.

Even though some inorganic compounds are on ChemSpider, most of the properties are unavailable. Consider the example of sodium chloride:


This doesn't mean that the situation is hopeless but it does make the challenge much more difficult. Solubility measurements and models for inorganic salts do exist (for example see Abdel-Halim et al.) but they are much more fragmented.

With the feedback we obtain from this search phrase approach - and hopefully help from experts in the chemistry community - we can piece together a federated service to provide reasonable estimates for most types of solubility behavior.

I think that this desalination solution will prove to
be a good test for automated (or at least semi-automated) scientific discovery in the realm of open solubility information. In order to pass the test, the phrase searching algorithm should eventually identify desalination as a "useful problem to solve" and should connect with the predicted behavior of water/NaCl/decanoic acid (or other similar compound).

Luckily we have Don Pellegrino on board. His expertise on automated scientific discovery should prove quite valuable for this approach.

Alfa Aesar melting point data now openly available

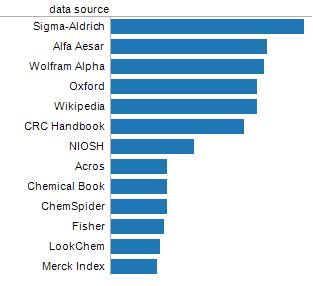
A few weeks ago, John Shirley - Global Marketing Manager at Alfa Aesar - contacted me to discuss the Chemical Information Validation results I posted from my 2010 Chemical Information Retrieval class. Our research showed that Alfa Aesar was the second most common source of chemical property information from the class assignment.
We explored some possible ways that we could collaborate. With our recent report of the use of melting point measurements to predict temperature solubility curves, the Alfa Aesar melting point data collection could prove immensely useful for our Open Notebook Science solubility project.

However, since we are committed to working transparently, the only way we could accept the dataset is if it were shared as Open Data. I am extremely pleased to report that Alfa Aesar has agreed to this requirement and we hope that this gesture will encourage other chemical companies to follow suit.

The initial file provided by Alfa Aesar did not store melting points in a database ready format - it included ranges, non-numeric characters and entries reporting decomposition or sublimation. One of benefits we could provide back to the company was cleaning up the melting point field to pure numerical values ready for sorting and other database processing. This processed collection contains 12986 entries. Note that these entries are not necessarily different chemical compositions since they refer to specific catalog entries with different purities or packaging.

For our purposes of prioritizing organic chemicals for solubility modeling and applications we curated this initial dataset by collapsing redundant chemical compositions and excluded inorganics (including organometallics) and salts. We did retain organosilicon, organophosphorus and organoboron compounds. Because the primary key for all of our projects depend on ChemSpiderIDs, all compounds were assigned CSIDs by deposition in the ChemSpider database if necessary. SMILES were also provided for each entry, as well as a corresponding link to the Alfa Aesar catalog page. This curated collection contains 8739 entries.

For completeness, we thought it would be useful to merge the Alfa Aesar curated dataset with other collections for convenient federated searches. We thus added the Karthikeyan melting point dataset, which has been used in several cases to model melting point predictions. This dataset was downloaded from Cheminformatics.org. Although we were able to use most of the structures in that collection, a few hundred were left out because of some difficulty in resolving some of the SMILES, perhaps related to the differences in algorithms used by OpenBabel and OpenEye. Hopefully this issue will be resolved in a simple way and the whole dataset can be incorporated in the near future. This final curated collection contains 4084 entries.

Similarly the smaller Bergstrom dataset was included after processing the original file to a curated collection of 277 drug molecules.

Finally, the melting point entries from the ChemInfo Validation sheet itself, generated by student contributions, is added to amount to a collection of currently 13,436 Open Data melting point values. We believe that this is currently the largest such collection and that it should facilitate the development of completely transparent and free models for the prediction of melting points. As we have argued recently, improved access to measured or predicted melting points is critical to the prediction of the temperature dependence of solubility.

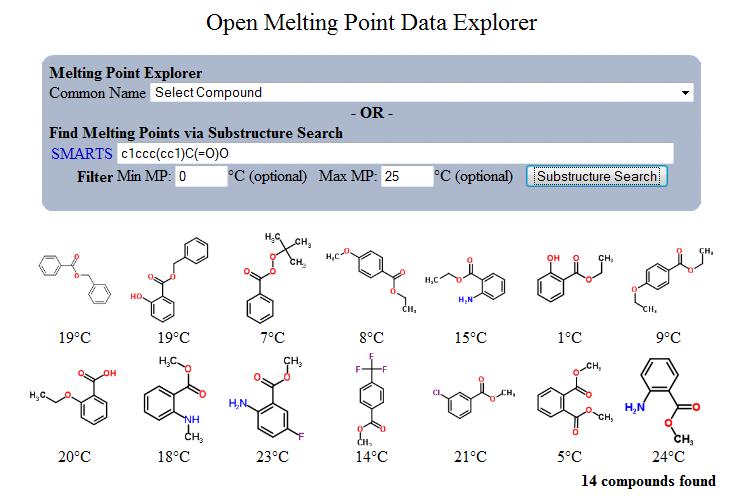
In addition to providing the melting point data in tabular format, Andrew Lang has created a convenient web based tool to explore the combined dataset. A drop down menu at the top allows quick access to a specific compound and reports the average melting point as well as a link to the information source. In the case of an Alfa Aesar source, a link to the catalog is provided, where the compound can be conveniently ordered if desired.
In another type of search, a SMARTS string can be entered with an optional range limit for the melting points. In the following example 14 hits are obtained for benzoic acid derivatives with melting points between 0C and 25C. Clicking on an image will reveal its source. (BTW even if you don't know how to perform sophisticated SMARTS queries, simply looking up the SMILES for a substructure on ChemSpider or ChemSketch will likely be sufficient for most types of queries).

Preliminary tests on a Droid smartphone indicate that these search capabilities work quite well.

Finally, I would like to thank Antony Williams, Andrew Lang and the people at Alfa Aesar (now added as an official sponsor) who contributed many hours to collecting, curating and coding for the final product we are presenting here. We hope that this will be of value to the researchers in the cheminformatics community for a variety of open projects where melting points play a role.

ONS Solubility Challenge Book cited in a Langmuir nanotechnology paper

An interesting application of the data from the Open Notebook Science Solubility Challenge has recently been reported in Langmuir: "Enhanced Ordering in Gold Nanoparticles Self-Assembly through Excess Free Ligands" by Cindy Y. Lau, Huigao Duan, Fuke Wang, Chao Bin He, Hong Yee Low and Joel K. W. Yang (Feb 24, 2011).

The context is as follows, and the reference is to Edition 3 of the ONS Solubility Challenge Book.

Although to our best knowledge there lacks literature value of OA solubility in the two solvents, the 10-fold better solubility of 1-otadecylamine (sic), the saturated version of oleylamine, in toluene than hexane is in line with our hypothesis.(33) This increased solubility caused the OA molecules that were originally attached to the AuNPs to gradually detach from the AuNPs, which is supported by our observations in poor AuNP stability and surface-pressure isotherms.

This is a nice application of solubility to understand and control the behavior of gold nanoparticles. It is in line with some of the applications I discussed at a recent Nanoinformatics conference, where I think there is a place for the interlinking of information between solubility and nanotechnology databases.

I have to admit that it is somewhat ironic to see this citation in Langmuir, given the controversy about a year ago (post and FF discussion) regarding the citation of non-traditional literature.

Science Online 2011 Thoughts

On January 15, 2011 I co-moderated a Science Online 2011 session on Open Notebook Science with Antony Williams and Carl Boettiger. The projector failed so we did our best to introduce the topic without relying on visual aids. My main objective was to demonstrate that it is not necessary for researchers (or their machines) to interface with the actual lab notebook to benefit from the information generated from the work. By introducing simple and rapid abstraction steps, both solubility and reaction information can be converted to web services for a variety of uses. As long as a link to the original lab notebook page (including the raw data) is attached, no information is lost and details can be investigated on demand.

One of the most powerful tools to use in this context is the tracking of chemical entities as ChemSpider IDs. This enables direct access to many other web services which Andrew Lang and I have leveraged to generate our own services. Tony spoke a bit more about this in his part and outlined some of the benefits and frustrations with crowdsourcing. Carl spoke eloquently about his experiences with Open Notebook Science as a graduate student for computational projects. The slides from all of us are provided below.

The overall tone of the discussion during our session was quite positive and productive. This was the case with all of the other sessions I attended, as it has been in prior years. The Science Online conference has evolved to attract a large proportion of people advocating Open Science. The presenters and the audience feel that they are among friends and the result is usually a free and easy exchange of ideas. Not all conferences and symposia relating to the online aspects of science share this. I have seen many examples where the "online science" theme is overrun by Closed Science proponents, for example commercial databases or Electronic Laboratory Notebook (ELN) vendors. Hopefully this conference will retain its Open Science focus in the future.

Kaitlin Thaney proved to be a very effective moderator during her session on "The Digital Toolbox: What's Needed?" and she stirred up some insightful discussion. I also enjoyed Steve Koch's session (co-moderated with Kiyomi Deards and Molly Keener) on "Data Discoverability: Institutional Support Strategies". Steve shared a particularly compelling example of the collaborative benefits of Open Notebook Science, where a computational research group came across images and videos from one of his group's notebooks and incorporated these in their paper - with all due credit acknowledged.

I very much appreciated the opportunity to catch up with old friends and some new. I had never met Carl Boettiger in person before and we had some very interesting discussions about Open Science and Open Education. It was good to meet Mark Hahnel from FigShare and explore possible paths for data sharing. I had some nice chats with Antony Williams, Steve Koch, Steven Bachrach, Heather Piwowar and Ana Nelson.

The Saturday evening banquet proved to be surprisingly entertaining. Despite the sedate title of her talk, "Out on a Limb: Challenges of Training Scientists to Communicate", Meg Lowman pounded the audience with a hilarious performance. Science comedian Brian Malow kicked this up a notch with some very clever material. Later on, using a brilliant comedic judo technique, he repeated some choice derisive comments he received from his performances on YouTube. I hope he comes back next year!

The Spectral Game with ChemDoodle

In the summer of 2009, we published an article on the Spectral Game. This game is based on spectra uploaded as Open Data (in JCAMP-DX format) on ChemSpider (currently about 2000 H NMRs and a few C NMRs, IRs and NIRs). Students get points by clicking on the molecule associated with the spectrum on display.

Although this has proved to be a useful tool to teach spectroscopy (especially H NMR), there have been some limitations, which are related to the use of Java (JSpecView) to provide an interactive display of the spectra.

1) Spectra do not display properly on Macs - there are problems with the "right-click" options in JSpecView. It took me a really long time to understand why some of my friends were really unimpressed by JSpecView. When I recognized that they were all Mac users I took a look and it became clear.

2) Spectra do not display at all on smartphones because of the Java components

I am very happy to report that these issues have been overcome (for the most part) using ChemDoodle. Through a collaborative effort between Kevin Theisen, Andrew Lang, Antony Williams and myself, we now have a non-Java based version of the Spectral Game at SpectralGame.com.

The game plays well on Mac, iPhone and iPad. However I have seen it fail on 2 Androids so there are still a few kinks to work out. Luckily I happen to be teaching NMR right now in my organic chemistry course so my students will be testing out the ChemDoodle version extensively.

There are some really nice additional features as well. My favorite is the auto-scaling of the integration line when zooming in. In the JSpecView version, integration is problematic because, when zooming into high field peaks, the start of the integration line does not reset to zero and this requires several iterations of changing the integration offset to get a usable measurement.

Another advantage in the ChemDoodle design is the simplicity of the interface. There are no right-click options: everything available is clearly labeled at all times (toggle integration, reset spectrum and view header information). This makes the game easier to learn and play.

I would especially like to thank Kevin Theisen for being so responsive on the ChemDoodle end. I was skeptical that we would have a playable game for this term but he addressed all of our major issues very quickly.